Monitoring druid query execution, ingestion, and coordination is essential for production clusters which are powering the user-facing dashboards. The expectation of these dashboards/widgets is to be loaded in a few seconds with near-realtime data. So monitoring the health of the druid cluster is required for production setups.
How can I emit the monitoring metrics?
We can configure Druid to emit metrics that are essential for monitoring query execution, ingestion, coordination, and so on.
To know more about all the metrics refer to the official documentation
Monitors Configuration:
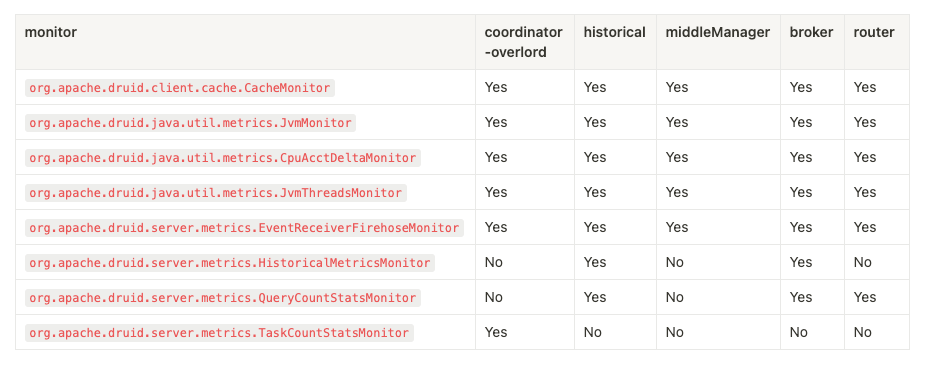
We need to use the monitors to monitor the respective processes to collect the metrics. Add this config in common.runtime.properties
druid.monitoring.monitors=["org.apache.druid.client.cache.CacheMonitor", "org.apache.druid.java.util.metrics.JvmMonitor", "org.apache.druid.java.util.metrics.CpuAcctDeltaMonitor", "org.apache.druid.java.util.metrics.JvmThreadsMonitor", "org.apache.druid.server.metrics.EventReceiverFirehoseMonitor", "org.apache.druid.server.metrics.TaskCountStatsMonitor"]Most of the production druid clusters will be running in a clustered deployment where we will be running master (coordinator, overload), data(middleManager, historical), and query(router, broker) nodes separately in different VMs
So we need to configure the druid.monitoring.monitors property according to the process we are running.
Example:
Master — (Coordinator-Overlord)
druid.monitoring.monitors=["org.apache.druid.client.cache.CacheMonitor", "org.apache.druid.java.util.metrics.JvmMonitor", "org.apache.druid.java.util.metrics.CpuAcctDeltaMonitor", "org.apache.druid.java.util.metrics.JvmThreadsMonitor", "org.apache.druid.server.metrics.EventReceiverFirehoseMonitor", "org.apache.druid.server.metrics.TaskCountStatsMonitor"]Data — (Historical, MiddleManager)
druid.monitoring.monitors=["org.apache.druid.client.cache.CacheMonitor", "org.apache.druid.java.util.metrics.JvmMonitor", "org.apache.druid.java.util.metrics.CpuAcctDeltaMonitor", "org.apache.druid.java.util.metrics.JvmThreadsMonitor", "org.apache.druid.server.metrics.EventReceiverFirehoseMonitor"]Query — (Broker, Router)
druid.monitoring.monitors=["org.apache.druid.client.cache.CacheMonitor", "org.apache.druid.java.util.metrics.JvmMonitor", "org.apache.druid.java.util.metrics.CpuAcctDeltaMonitor", "org.apache.druid.java.util.metrics.JvmThreadsMonitor", "org.apache.druid.server.metrics.EventReceiverFirehoseMonitor", "org.apache.druid.server.metrics.QueryCountStatsMonitor"]Emitter Configuration:
We need to add/edit the following config in the common.runtime.properties file to enable the emitter which emits metrics to an HTTP endpoint.
druid.emitter=http
druid.emitter.http.recipientBaseUrl=http://{{druid_exporter_host}}:{{druid_exporter_port}}/druid
Restart the nodes/processes after adding the above emitter and monitoring the config
Druid Exporter:
To collect and export metrics from druid we have an open-source druid exporter from Opstree — https://github.com/opstree/druid-exporter
Installation:
We can deploy the druid exporter using
releases — https://github.com/opstree/druid-exporter/releases
Kubernetes — https://github.com/opstree/druid-exporter/tree/master/manifests
docker-compose — https://github.com/opstree/druid-exporter/tree/master/compose
I will be going with release deployment directly — running druid exporter in one of the master nodes
wget https://github.com/opstree/druid-exporter/releases/download/v0.11/druid-exporter-v0.11-linux-amd64.tar.gz
tar -xvzf druid-exporter-v0.11-linux-amd64.tar.gz
Let’s create a systemd file to run the druid-exporter
[Unit]
Description=Druid Exporter
Documentation=https://github.com/opstree/druid-exporter
Requires=network.target
After=network.target
[Service]
Type=simple
WorkingDirectory=/opt
User=root
Group=root
ExecStart=/PATH_TO_DOWNLOADED_FOLDER/druid-exporter -p 8020 -d DRUID_COORDINATOR_OR_ROUTER_URL --druid.user="" --druid.password="" --metrics-cleanup-ttl=15 --no-histogram
[Install]
WantedBy=default.target
Available options and flags — https://github.com/opstree/druid-exporter#available-options-or-flags
Enable the systemd file
systemctl enable druid-exporter.serviceStart the druid-exporter
systemctl start druid-exporterVerify the installation and check the metrics in the endpoint
curl http://druid_export_host:port/metricsGrafana dashboard:
Cool, we have emitted, collected, and exported the monitoring metrics to Prometheus. Now it’s time to visualize and create alerts (if needed).
We have added more panels and visualization to the existing dashboard provided by Opstree. Download the Grafana dashboard JSON from here.
Corrections/suggestions are welcome. Thanks for reading.
References:
https://github.com/opstree/druid-exporter
https://druid.apache.org/docs/latest/configuration/#enabling-metrics


